JVM Profiling
1. Flight Recorder
- JFR Event Collections
- Java Flight Recorder Events
- OpenJDK - JFR EventNames
- OpenJDK - JFR Profile Configs
2. Java Mission Control
# https://jdk.java.net/jmc/
# https://adoptium.net/jmc
# https://github.com/adoptium/jmc-build/releases
# https://github.com/corretto/corretto-jmc/releases
# https://www.oracle.com/java/technologies/jdk-mission-control.html
# https://www.azul.com/products/components/zulu-mission-control/

$ curl https://github.com/adoptium/jmc-build/releases/download/8.2.0/org.openjdk.jmc-8.2.0-macosx.cocoa.x86_64.tar.gz | tar xv -

$ rm -rf "/Applications/JDK Mission Control.app"
$ mv "JDK Mission Control.app" /Applications
$ open '/Applications/JDK Mission Control.app'

# To run with a JDK
$ ./jmc -vm %JAVA_HOME%\bin
# or
$ open '/Applications/JDK Mission Control.app' --args -vm $JAVA_HOME/bin
3. Visualization
FlameGraph of java threads
$ wget https://github.com/brendangregg/FlameGraph/raw/master/flamegraph.pl
$ wget https://github.com/brendangregg/FlameGraph/raw/master/stackcollapse-jstack.pl
$ chmod +x *.pl

# Run multiple times to get more samples
$ jcmd GradleDaemon Thread.print >> jcmd.tdump
$ stackcollapse-jstack.pl jcmd.tdump > jcmd.tdump.folded
$ flamegraph.pl --color=io --title "Thread Dump" --countname "Samples" --width 1080 jcmd.tdump.folded > jcmd.tdump.svg
JFR to FlameGraph
# Download the latest release from Github
$ LOCATION=$(curl -sL https://api.github.com/repos/jvm-profiling-tools/async-profiler/releases/latest \
    | grep -i "browser_download_url" \
    | grep -i "converter.jar" \
    | awk '{ print $2 }' \
    | sed 's/,$//'       \
    | sed 's/"//g' )     \
    ; curl --progress-bar -L -o ${HOME}/install/tools/converter.jar ${LOCATION}

$ java -cp ${HOME}/install/tools/converter.jar \
       jfr2flame --total --dot --lines  \
       openjdk-playground.jfr flame.html
$ open flame.html
CPU/Memory Viz of a process
# Download the script
$ wget https://github.com/sureshg/openjdk-playground/raw/main/scripts/cpu-mem-viz.sh
# Record CPU/Memory usage of a process
$ ./scripts/cpu-mem-viz.sh --pid <pid>

# Generate visualization using gunplot
$ ./scripts/cpu-mem-viz.sh --pid <pid> -a gnuplot
$ open -a "Google Chrome" gnuplot-<pid>.svg

# Generate visualization using vega-lite
$ sudo npm install -g vega-lite vega-cli
$ ./scripts/cpu-mem-viz.sh --pid <pid> -a vega
$ open -a "Google Chrome" vega-lite-<pid>.svg
Misc Tools
# Using htop
$  htop -p $(pgrep -f idea)

# Using psrecord
$ pip install matplotlib psrecord
$ psrecord $(pgrep -f idea) --plot plot.png --log activity.txt --include-children --duration 5
$ open plot.png4. Profilers & Tools
- Async Profiler
- Perf-map Agent
- JFR to Flame Graph Converter
- FlameGraph
- jconsole
- jmxviewer
- Cryostat
- Linux Perf - JVMTI
5. Commands
Wizard to create configuration files (.jfc)
$ jfr configure --interactive
$ jfr summary openjdk-playground.jfr

# Concat multiple JFR files
$ jfr assemble <repository> <file> // cat jfr_file_version_* >> combined.jfr

# Print specific event details
$ jfr print --events 'jdk.*' --stack-depth 64 openjdk-playground.jfr
$ jfr print --events CPULoad,GarbageCollection openjdk-playground.jfr

# Pinned virtual threads
$  jfr print --events jdk.VirtualThreadPinned openjdk-playground.jfr

# Remove passwords from JFR
$  jfr scrub --exclude-events InitialEnvironmentVariable recording.jfr no-psw.jfr

# Search for JFR metadata
$ jfr metadata | grep -i -e "tls" -e "x509" -e "security" | grep -i "@Name"
Some config options are,
-XX:StartFlightRecording:filename=recording.jfr
-XX:FlightRecorderOptions:stackdepth=256

-XX:+HeapDumpOnOutOfMemoryError
-XX:ErrorFile=$USER_HOME/java_error_in_app_%p.log
-XX:HeapDumpPath=$USER_HOME/java_error_in_app.hprof
Find finalizable objects in your application
$ java -XX:StartFlightRecording:filename=dump.jfr ...
$ jfr print --events FinalizerStatistics dump.jfr
6.JFR Streaming
7. HeapDump
Analyze using JOL
 $ curl -sL https://builds.shipilev.net/jol/jol-cli-latest.jar > jol-cli.jar
$ java -jar jol-cli.jar heapdump-stats heapdump.hprof- Solving Memory Leaks without Heap Dumps
- Graal Heapdump Builder
- Java Profiler Heap Dump Format
- HPROF Parser
- Capture Java Heap Dumps
8. ThreadDump
# Get all java processes
$ jcmd -l
$ jps -mlvV

# See the available commands for all java processes
$ jcmd 0 help
# Use PID or main class
$ jcmd dev.suresh.Main VM.version
$ jcmd <dev.suresh.Main | pid> Thread.print

# Virtual thread dump
$ jcmd dev.suresh.Main Thread.dump_to_file -format=json openjdk-playground-threads.json

# OR
$ kill -3 <pid>
$ kill -3 "$(jcmd -l | grep "dev.suresh.Main" | cut -d " " -f1)"
# OR
# Prints additional info about thread (-e  extended listing) and locks (-l  long listing)
$ jstack -l -e  <pid>

# Show Native Memory
$ jcmd GradleDaemon VM.native_memory
9. Load Testing
# Run Gataling Recorder and select listening port as 9999
$ ~/install/gatling/bin/recorder.sh

$ Confiure it as system proxy
GATALING_PROXY_PORT=9999
NETWORK_SERVICE="Wi-Fi"
networksetup -getwebproxy $NETWORK_SERVICE
networksetup -getsecurewebproxy $NETWORK_SERVICE
networksetup -setwebproxy $NETWORK_SERVICE localhost $GATALING_PROXY_PORT
networksetup -setsecurewebproxy $NETWORK_SERVICE localhost $GATALING_PROXY_PORT

# Browse the application URLs, Stop recording & Switch off the proxy
networksetup -setwebproxystate $NETWORK_SERVICE off
networksetup -setsecurewebproxystate $NETWORK_SERVICE off

# Run simulation
$ ~/install/gatling/bin/gatling.sh --run-mode local --simulation dev.suresh.LoadTest
10. Unified GC Logging
$ java -Xlog:help

# For G1GC
$ java -XX:+UseG1GC
-XX:MaxGCPauseMillis=200
-XX:InitiatingHeapOccupancyPercent=70
-XX:+PrintGC
-XX:+PrintGCDateStamps
-XX:+PrintGCDetails
-Xloggc:/log/gclogs/app-gc.log
-XX:+UseGCLogFileRotation
-XX:NumberOfGCLogFiles=15
-XX:GCLogFileSize=10M ...
11. JVM Tools
Java Object Layout (JOL)
$ wget -q https://builds.shipilev.net/jol/jol-cli-latest.jar
$ java -jar jol-cli-latest.jar internals java.lang.String
12. System/Node Health
SAR (System Activity Report)
$ yum install sysstat $ sar -A # Generate file for single day: $ sar -A -f /var/log/sa/sa19 > /tmp/sa19_$(hostname).txt # Generate file for multiple days files: $ ls /var/log/sa/sa?? | xargs -i sar -A -f {} > /tmp/sar_$(uname -n).txt- https://github.com/vlsi/ksar
- https://github.com/sargraph/sargraph.github.io
- https://sarcharts.tuxfamily.org/
- https://www.cyberciti.biz/tips/top-linux-monitoring-tools.html
13. Commands
Grabbing a file from a remote system with ssh
# grabbing a file from a remote system with ssh but no scp binary

$ ssh user@remote-system "cat <file.txt" > file.txt
$ ssh user@remote-system  'tar -S cz somedirectory' | tar -S xvz

# Using Rsync: Upload
$ rsync -Pavze ssh path/to/src remote-system:path/to/dst
# Download
$ rsync -Pavze ssh remote-system:path/to/src path/to/dst
Strace
# Syscall trace
$ strace -tttTf -p <pid>
Netstat
$ netstat -tunalp

# Socket stats
$ ss -s
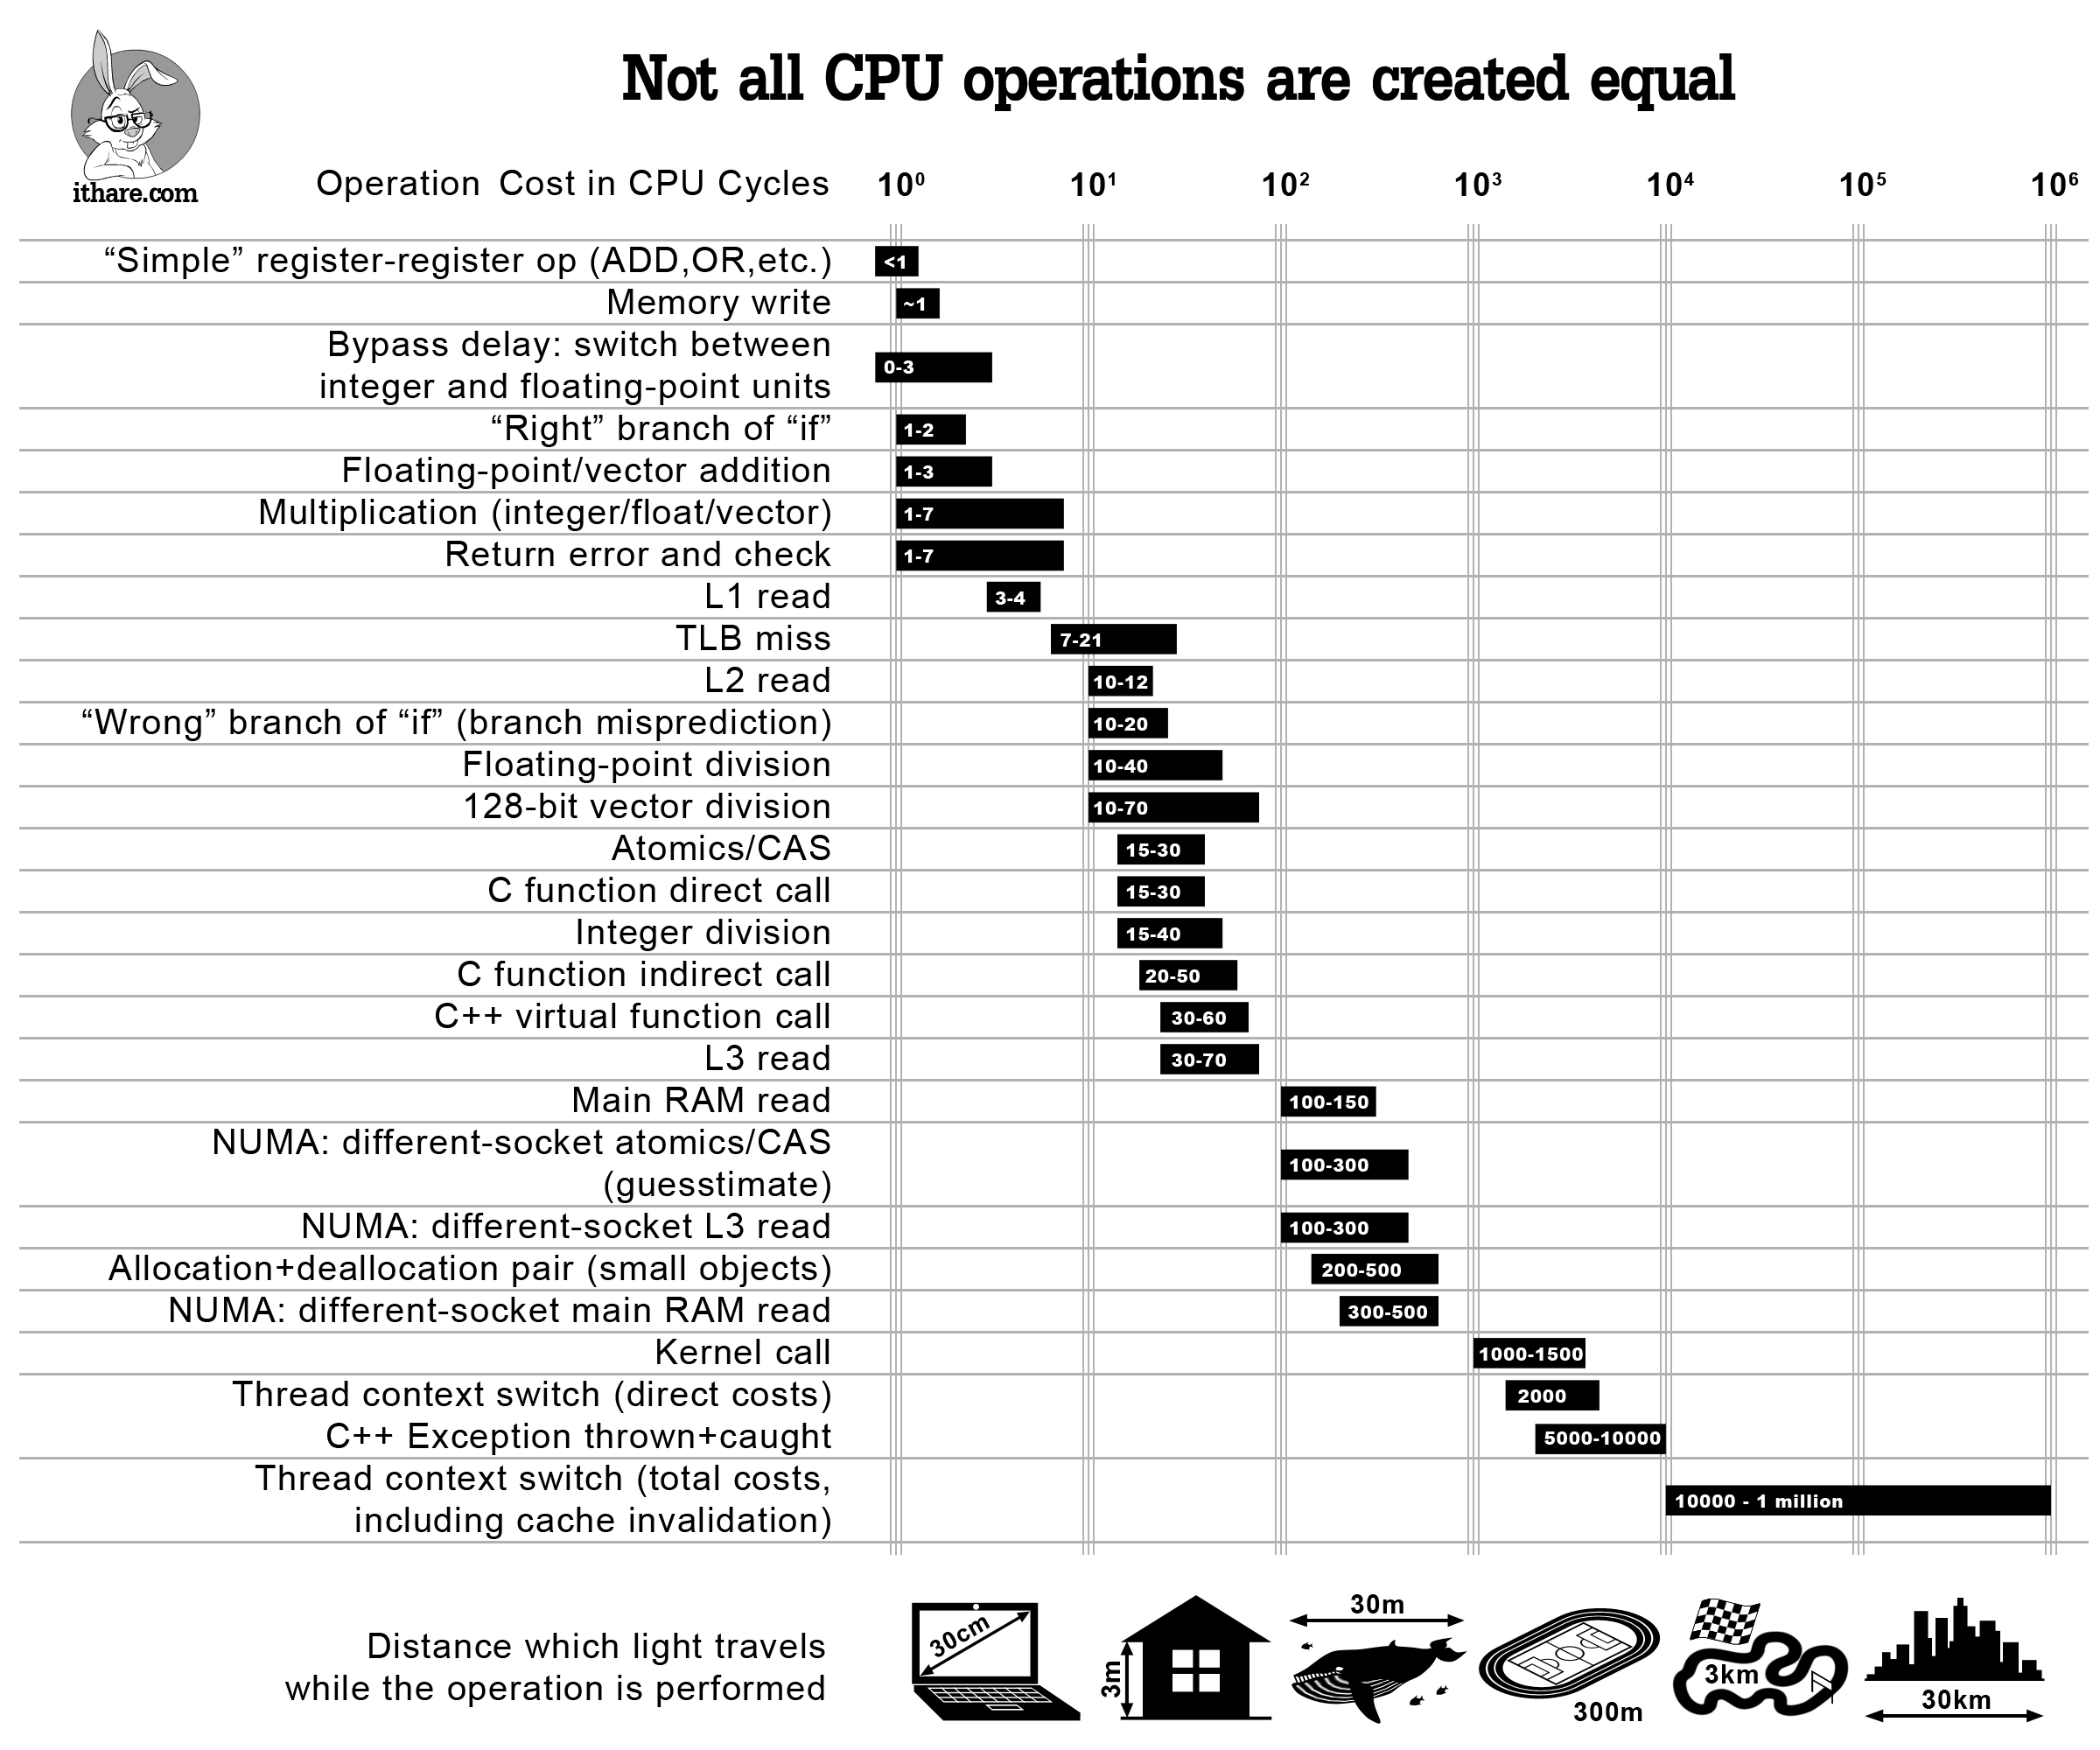
14. Clock Cycles